- Home
- Azure
- Apps on Azure Blog
- Unleashing Code-Level Improvements with Azure Load Testing and AI
- Subscribe to RSS Feed
- Mark as New
- Mark as Read
- Bookmark
- Subscribe
- Printer Friendly Page
- Report Inappropriate Content
The enchantment of AI has cast its spell on us, urging us to include it further into our daily lives. In the software industry, a significant chunk of our efforts revolves around discovering ways to optimize code and enhance system performance. If only AI could lend a hand in this process—well, your wish is our command!
Riding the AI wave, we present a powerful combination of tools: the Application Insights Profiler, Code Optimizations, and Azure Load Testing, designed to unveil bottlenecks within your code when your application is grappling with heavy load.
This blog will walk you through steps to obtain these code-level suggestions to improve your system’s performance.
Application Insights Profiler
Application Insights Profiler is a feature in Azure Monitor that helps you capture, identify, and view performance traces for your application running in Azure. After enabling Application Insights Profiler, you can start a new profiling session, configure Profiler triggers, and view recent profiling sessions.
Code Optimisations with Application Insights
Code Optimizations is an AI-based service in Azure Application Insights that works in tandem with the Application Insights Profiler to help you create better and more efficient applications. It detects CPU and memory usage performance issues at a code level and provides recommendations on how to fix them. Code Optimizations analyses the profiling data collected by the Application Insights Profiler and displays aggregated data gathered over time.
Azure Load Testing
Azure Load Testing is a service in Azure that helps you optimize your application’s performance and scalability by simulating real-world traffic. You can use Azure Load Testing to simulate traffic to your application and services, monitor resource metrics, and gain insights into performance and scalability issues.
Quick Steps to Unlock Code-Level Suggestions
To obtain AI suggestions on code improvement,
all you need is a .NET application on Azure with Application Insights enabled. Now, let’s get down to business!
- Enable Profiler for your application.
- If you already have an Azure Load Test for your .NET application, then proceed to step 3. Otherwise, go to Azure Load Testing and follow these steps to create load tests on your .NET Application.
- Generate high-scale traffic to your application by running the load test that you created. Simultaneously, collect profiles of your .NET application.
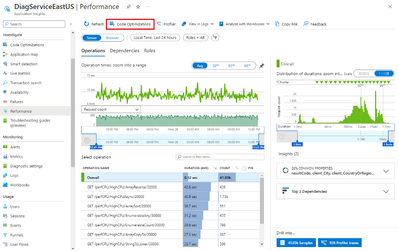
- Once the load test and profile collection are completed, you can view code level optimizations by navigating to Application Insights->Performance blade and then clicking on ‘Code Optimizations’ as shown below.
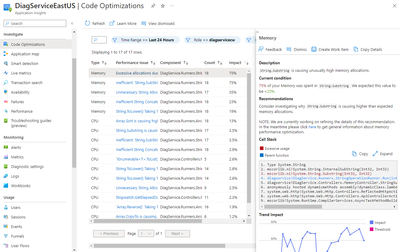
- The result page of Code Optimizations enlists recommendations on actionable code changes to improve memory and CPU consumption as shown below. It also gives an estimate on the degree of improvement that the system’s performance can undergo after the code change has been made. You can refer to this to get detailed information on Code Optimizations.
- Implement the recommended changes to your code.
- Create another Test Run for the application after optimizing its code.
- Compare the Test Runs before and after making code-level optimizations and revel in the improvement in response times and throughput!
In the grand scheme of things, is there anything AI can't do? Witness how seamlessly it analysed profiles of your application under heavy load, suggesting code changes to boost performance. Embrace the power of AI and elevate your code to new heights!
You must be a registered user to add a comment. If you've already registered, sign in. Otherwise, register and sign in.

