- Home
- Azure
- Apps on Azure Blog
- Azure App Service Limit (5) - Memory (Windows)
- Subscribe to RSS Feed
- Mark as New
- Mark as Read
- Bookmark
- Subscribe
- Printer Friendly Page
- Report Inappropriate Content
This is the 5th blog of a series on Azure App Service Limits illustrations:
1) Azure App Service Limit (1) - Remote Storage (Windows) - Microsoft Community Hub
2) Azure App Service Limit (2) - Temp File Usage (Windows) - Microsoft Community Hub
4) Azure App Service Limit (4) - CPU (Windows) - Microsoft Community Hub
5) Azure App Service Limit (5) - Memory (Windows) - Microsoft Community Hub
High memory usage is another common cause of performance issues within an application, the blog will provide insights into how to check for high memory usage within Azure App Services, enabling you to identify any potential memory-related bottlenecks.
The high memory issue is like high CPU, it is a machine level resource exhausted issue. There are a few questions are very similar to the CPU limit, and those questions we've covered in the Azure App Service Limit (4) - CPU (Windows) - Microsoft Community Hub , you can just replace the CPU with the memory and check from there:
- Where can I check if the machine is experiencing high memory issues? Diagnose and solve problems =>Availability and Performance => Memory Analysis
- There are multiple metrics for the app service memory usage, which one should I rely on?
- Why the memory usage is high while the application memory consumption is low?
- Why some of the machines have high memory issue while others are not? Is there any issue with those high memory machines?
- Where can I check which process caused the high memory? Diagnose and solve problems =>Availability and Performance=>Memory Analysis => Memory Drill Down
Except the above questions, we still have following questions would like to share:
1. Is there any threshold related to memory for the Azure App service?
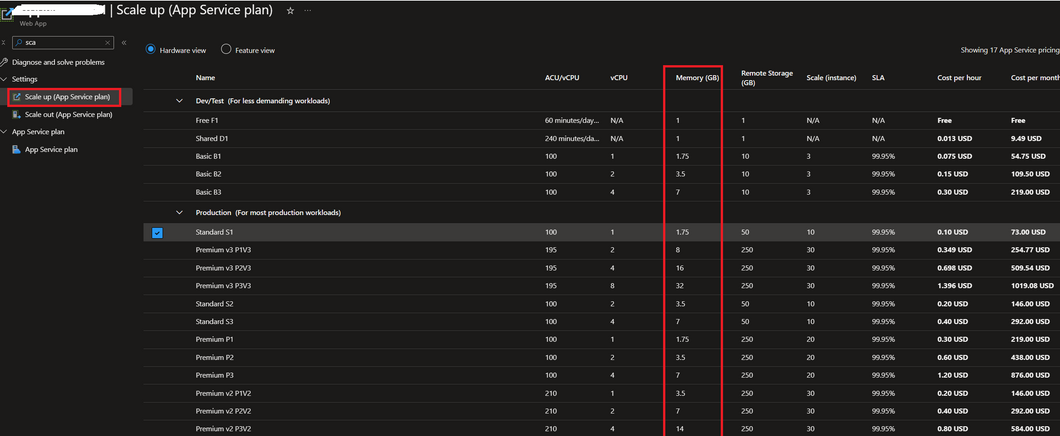
Generally speaking, it is advisable to keep memory usage below the threshold of 70-80% to avoid potential performance issues in most applications. However, it's important to note that there can be cases where applications may still experience recycling, even if the average memory usage is below that specified threshold. This can occur when the maximum available memory size is relatively small.
We can check the machine's RAM size from the Scale up blade of the App service as below:
2. What type of memory issues should I concern with?
There is no doubt that high memory usage can indicate a potential issue, and it should be carefully monitored and investigated.
However, in addition to high memory usage, another common memory issue to consider is Memory Leak. Memory leaks occur when memory usage continuously increases, even if the request volume decreases. This situation arises when system resources are not released as expected, leading to the accumulation of memory over time. It is crucial to identify the cause of the memory leak, address it, and prevent resource exhaustion that can result in performance issues.
There are some common causes of memory leaks, including handle leak, increasing thread count, and specific object types. These potential causes can be verified using the following methods:
- Handle leak, we can check from the Diagnose and Solve Problems => Search Handle Count, and check if the handle count follows the same trend as the increasing memory usage. If they exhibit a similar pattern, it may indicate the need to review the code for potential issues such as unclosed connections or files, which could lead to the continuous creation of handles.
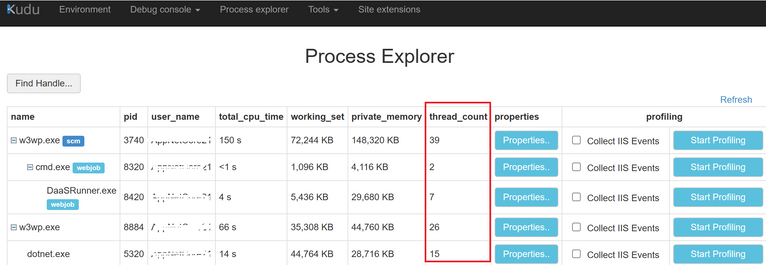
- High thread count, there is no publicly available metric data for this specific metric. However, you can monitor the thread count of the application process in real time using the Kudu site's Process Explorer. By observing the thread count, you can verify if it has been increasing over time. If you suspect that the issue is caused by the high thread count, it is important to investigate whether there are any deadlocks in the code that could be preventing the threads from completing as expected.
- Specific object types, specifically in .NET or .NET Core applications, you can capture several memory dumps during memory increases, and then compare the object count and size to draw conclusions.
3. Why do I get Out-of-Memory Exception(OOM) in the application log despite not observing high memory usage from the metrics?
Since our metric data is sampled periodically, there are scenarios where certain issues may occur randomly or with a significant time gap between them. In such cases, the sampled metric data might not be able to capture or reflect the issue accurately or prominently in the generated diagrams.
Another very common cause is the site is running in 32-bit over a big machine. Such as a 32-bit .NET or .NET Core application, the maximum memory address that can be accessed is limited to 4GB. This means that even if the application is deployed on a larger machine with 8GB, 16GB, or 32GB of RAM, the application itself cannot fully utilize these resources beyond the 4GB limit. However, the metric data reflects the total memory usage of the entire machine, it may not show high memory usage in the metrics even if it is running out of the available 4GB.
To check if an application is running in a 32-bit environment, you can follow these steps:
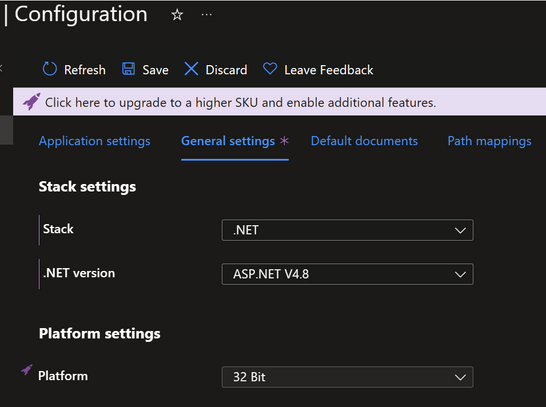
(1) Check the platform setting from App service Configuration, such as below is a .NET application and it is set to 32-bit.
(2) Check the application process
Sometimes, even if the platform's IIS process (w3wp.exe) is set to 64-bit, the application itself may be running in a separate process that could be configured to run in a 32-bit environment. To determine the loading path of the application process, you can follow these steps:
You can go to the Process explorer of the kudu site, right click the application process and select the Properties, then we will get to the know it's loading path. For example, consider my sample .NET Core application below: It is running out of process, and we can observe that the dotnet.exe file is being loaded from the C:\Program Files(x86) directory. This directory indicates that the application is running as a 32-bit application.
4. What should I do if the memory usage is high?
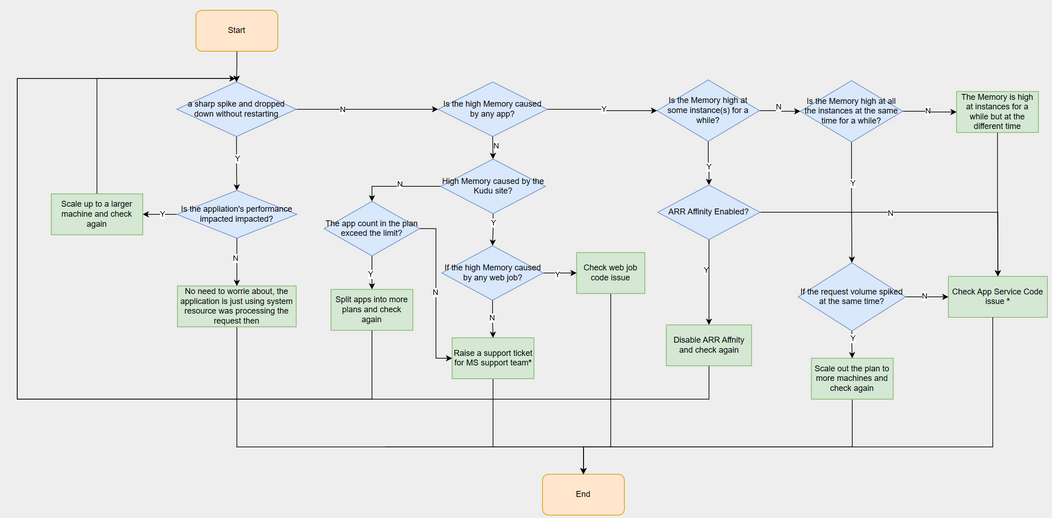
We can refer to the diagram below, which is similar to the one used to diagnose high CPU usage. The purpose of both diagrams is to narrow down the issue by analyzing configurations at a high level.
There are a few important items that require attention:
(1) Memory leak caused by the App Service Editor
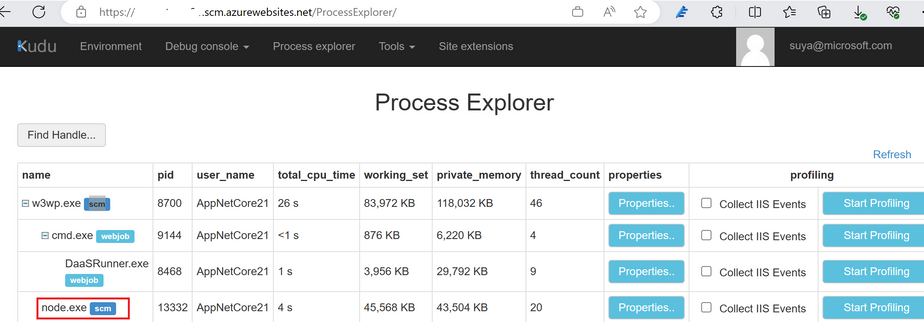
If you determine that the high memory issue is related to the Kudu site, before raising a support ticket with Microsoft, you can check if there is a node.exe process running under the Kudu process (w3wp.exe with scm) and it has high memory usage. Such as below snapshot of my sample site (the memory usage for node.exe is not high yet):
Please kill it if you don't have any web job using node.js.
That is likely the case as the node.exe process is most likely initiated by the App Service Editor, and this tool has a known issue that may result in memory leaks. However, since this tool is in a preview state, it may not be promptly fixed. In light of this, I would recommend updating the code using Visual Studio or any other local developer tools. Subsequently, you can publish the updated code to the App Service instead of relying on editing it online through the App Service Editor.
(2) High memory is caused by the application itself
If we have identified that the high memory is caused by the application process and the application in .NET or .NET core, we can capture memory dump for the further investigation. Regarding how to capture memory dump you can refer to blog capture several memory dumps for detail.
You must be a registered user to add a comment. If you've already registered, sign in. Otherwise, register and sign in.
