- Home
- Azure
- Apps on Azure Blog
- Announcing New Features for Enhanced Cluster Troubleshooting
- Subscribe to RSS Feed
- Mark as New
- Mark as Read
- Bookmark
- Subscribe
- Printer Friendly Page
- Report Inappropriate Content
In the dynamic world of cloud-native applications and microservices, it's crucial to excel in observability and troubleshooting within your AKS clusters. Timely diagnosis and resolution of deployment issues are key to meeting service level objectives (SLOs) and service level incidents (SLIs) while reducing downtime.
Today in Azure Portal, we're introducing three new features that will redefine your cluster troubleshooting experience:
- Kubernetes events: While troubleshooting your cluster, you might face problems such as pod evictions, node failures, or application crashes. Kubernetes events provide real-time notifications about these events, helping you quickly diagnose the root causes of issues. By monitoring events, you can pinpoint the exact moment when an issue occurs and take immediate corrective actions.
- Cluster autoscaler metrics: If your cluster experiences fluctuating workloads or resource constraints, cluster autoscaler metrics can assist in identifying when and how the autoscaler is making scaling decisions. This insight helps troubleshoot scaling issues and fine-tune your cluster's resource allocation for optimal performance.
- Node saturation metrics: In the event of application slowdowns or resource allocation issues, node saturation metrics can help identify nodes that are struggling to meet resource demands. This feature is invaluable when troubleshooting performance bottlenecks in your cluster, ensuring you can allocate resources optimally.
Kubernetes Events: Real-time Cluster Signals
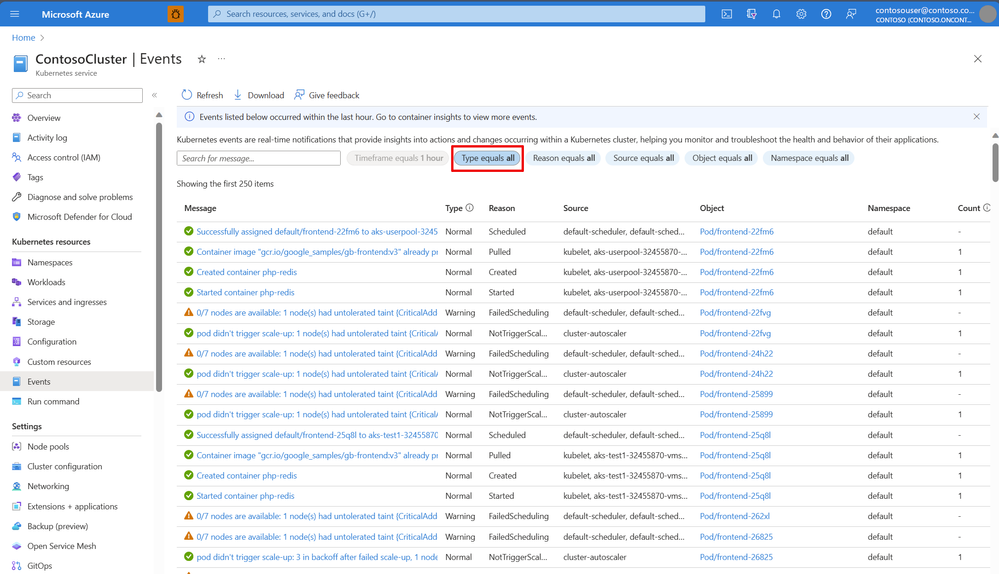
Kubernetes events provide a real-time mechanism for tracking and communicating significant occurrences and state changes within your cluster. Whether it's the creation of a new pod, a node failure, or an application deployment, events capture crucial information like event types, involved objects, reasons, and descriptive messages.
You can browse the events of your cluster by navigating to the Events menu item under Kubernetes resources from the Azure portal overview page for your cluster. By default, all events are shown:
Note: Kubernetes events do not persist throughout your cluster life cycle, as there is no mechanism for retention. They are short-lived, only available for one hour after the event is generated. To store events for a longer time period, enable Container Insights.
Learn more about Kubernetes events here: Use Kubernetes events for troubleshooting
Cluster Autoscaler Metrics: Resource Allocation Fine-Tuning
Cluster autoscaler (CAS) is a feature that automatically adjusts the size of your AKS cluster based on workload demands. It scales up the cluster by adding nodes when there are pending pods that can't be scheduled due to resource constraints, and scales down by removing idle nodes to save resources. It helps optimize resource utilization and ensures your cluster can handle varying workloads efficiently. To enhance troubleshooting and observability across the node pools in your cluster, we've surfaced additional metrics to inform scaling related problems you may encounter.
Navigate to the Node pools blade to see it updated with useful CAS information, entrypoints for adjusting scale parameters and CAS-events:
Upon clicking into any of the event cards, you will see a filtered list of CAS-specific events, allowing you to root cause node pools not reaching their target node count and other issues:
Learn more about cluster autoscaling here: Use the cluster autoscaler in Azure Kubernetes Service (AKS)
Optimizing Node Performance with Node Saturation Metrics
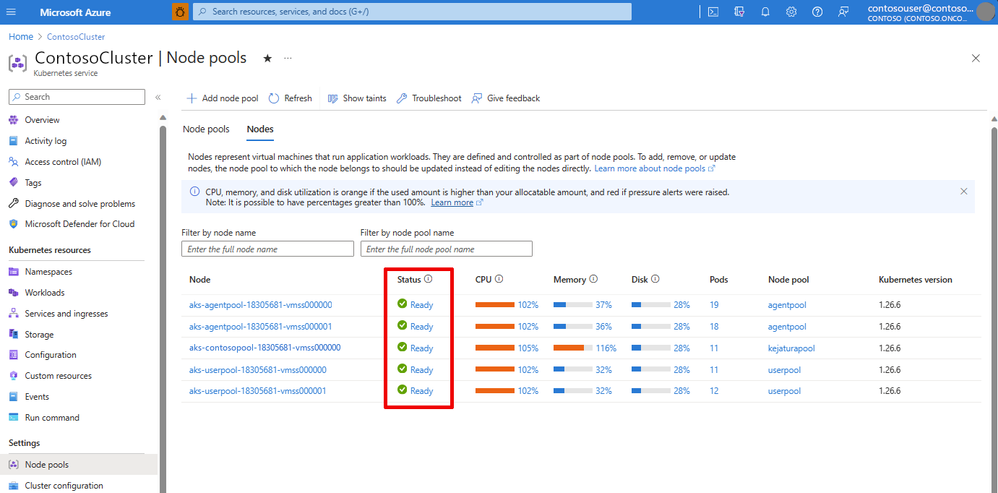
Maintaining the right balance of resources in your AKS cluster is essential for your applications to run smoothly. When a node becomes overloaded, it can lead to application slowdowns, process timeouts (context deadline exceeded), and even failures. To address this, we've introduced node saturation metrics for CPU, Memory, and Disk utilization, directly sourced from the Kubernetes API.
Note below that the CPU, memory, and disk utilization metrics are colored orange if the used amount is higher than your allocatable amount, and colored red if pressure conditions were triggered. It is possible to have percentages greater than 100% due to how the Kubernetes API allocates for resource reservations, learn more: Resource reservations (AKS) | Microsoft Learn
You can browse nodes and their utilization metrics in the Nodes view of the Node pools page in AKS Portal:
To see any pressure conditions that may have fired on your nodes, you can click directly on their status to drill down the root cause:
Learn more about node saturation troubleshooting: High CPU usage remediation steps | High Memory usage remediation steps
You must be a registered user to add a comment. If you've already registered, sign in. Otherwise, register and sign in.


