- Home
- Azure
- Apps on Azure Blog
- Web App Performance Root Cause Analysis with Application Insights
- Subscribe to RSS Feed
- Mark as New
- Mark as Read
- Bookmark
- Subscribe
- Printer Friendly Page
- Report Inappropriate Content
Overview
Having the ability to identify clear root cause for incidents in production workloads is valuable, the best way to prevent future incidents is to understand what caused past ones. Of course you can have a good set of load tests but still, incidents in production environments can happen and it's crucial to have available data that can help to understand what happened so application can be improved and prevent replications.
In this article we will learn how to use Application Insights and automatic profiler to find root cause for past incidents and prepare logging platform to ensure meaningful data for analysis.
Check configuration
This guide relies in the Application Insights Profiler, the list of supported platforms is listed here:
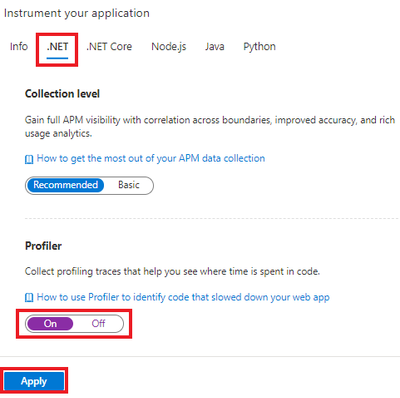
The profiler is active by default in the supported platforms when Application Insights is enabled from the Azure portal. For App Services just need to have the flag on, just like shown in image bellow:
[Image 1]
For more details on how to enable Profiler check here: https://learn.microsoft.com/en-us/azure/azure-monitor/profiler/profiler, there are specific instructions to enable in other services.
Isolate relevant data in a concrete scenario
Having a good problem description is a good start to understand the cause. Start by getting clear definition of what went wrong, here are some questions that help to narrow down:
- What? Get a good description of the issue, what was observed.
- When? Get start and end time, understand if still happening and any events that might be the trigger.
- Where? Make sure to be looking for the right resource.
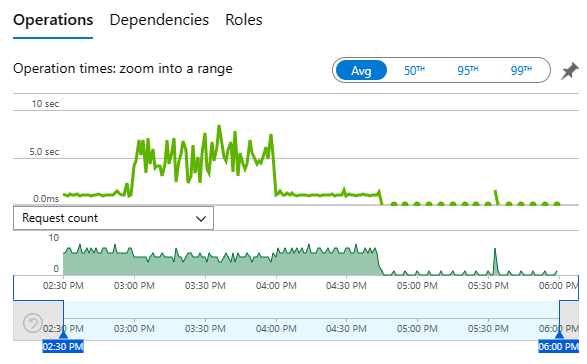
In this example application experienced high CPU usage and latency for some time, that can be confirmed going to Performance tab in the Application Insights resource. Note that using the drop-down can switch between request count, CPU, memory and storage while comparing with application latency. Bellow checking request count together with latency:
[Image 2]
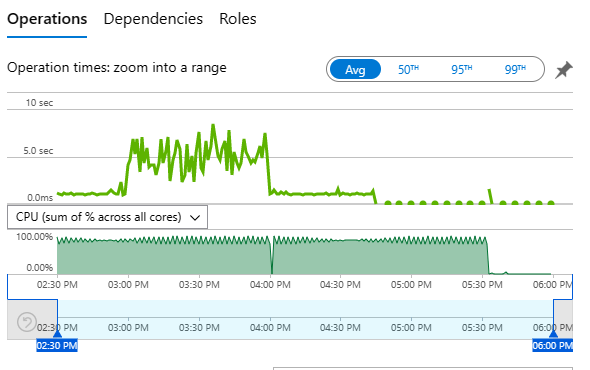
And now request count with CPU usage:
[Image 3]
Besides selecting the interesting time frame, make sure to select only the relevant roles in case there are several applications sending data to the same Application Insights resource. If needed, filter the resources using the Roles button:
[Image 4]
Some details can already be extracted from above charts:
- Request latency does not seem to be directly caused by load increase;
- CPU usage does not correlate with higher load or latency;
In cases where latency or higher CPU usage is directly related with load increase it's because the resources available to the application are just not enough for the load, auto scale rules can be created to adapt the resources to the required load.
Read more about auto scaling here:
https://learn.microsoft.com/en-us/azure/architecture/best-practices/auto-scaling
https://learn.microsoft.com/en-us/azure/app-service/manage-scale-up
https://learn.microsoft.com/en-us/azure/azure-monitor/autoscale/autoscale-get-started
Finding the latency source
Data shows the application using high CPU and some latency periods that do not fully match so let's start by isolating the slow requests and try to understand why are they taking time.
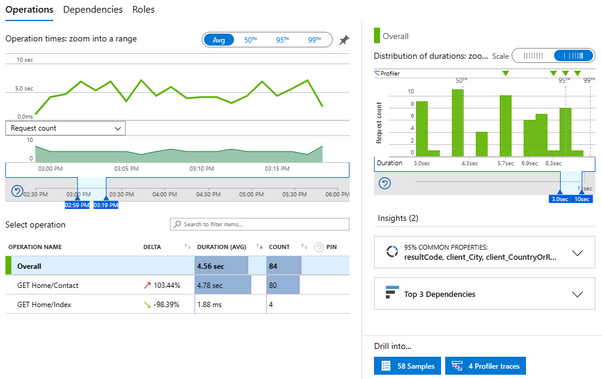
This view actively filters the data dynamically as selection is applied to any of the components. So, selecting the interesting time frame in the chart will filter data in the other components matching only that same time frame.
[Image 5]
Same is true for other components in the view, selecting a specific operation will show the latency only for that operation, the distribution of duration and the blue buttons in the bottom for samples and traces is also scoped. After selecting the interesting time frame and only requests over 3 seconds:
[Image 6]
Notice the number of samples and traces available is now much lower, filtering avoid losing time with data that is not relevant. Using the samples button will show a list of operations that fits into the selected filters and allowing to drill down into details:
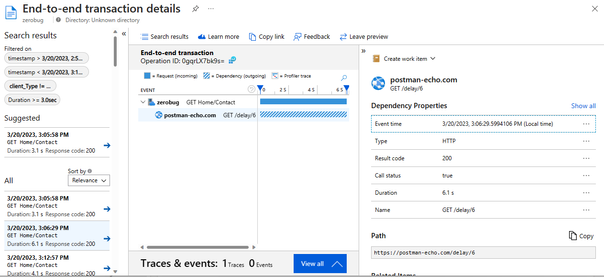
[Image 7]
Looking at the transaction timeline is pretty straightforward to understand if operation delay was caused by slow dependency call(s), many dependency calls or not related at all with dependencies. Example in image above is clearly caused by a dependency call to an external web site. Selecting the dependency line shows extra details about that dependency.
Here is all about connecting the dots, understand patterns. One single slow request might be irrelevant but having many slow requests caused by calls to the same location is definitely something to look for. Better to check several slow requests to understand pattern and which dependency or dependencies are causing the delays.
What about when latency is not caused by dependencies? Application Insights detects several types of external calls although application code can cause the correlation to fail and not being displayed in the transaction timeline. For a list of dependency calls that are collected automatically please check: https://learn.microsoft.com/en-us/azure/azure-monitor/app/asp-net-dependencies#dependency-auto-colle...
Figure bellow shows a transaction where no dependency call was detected:
[Image 8]
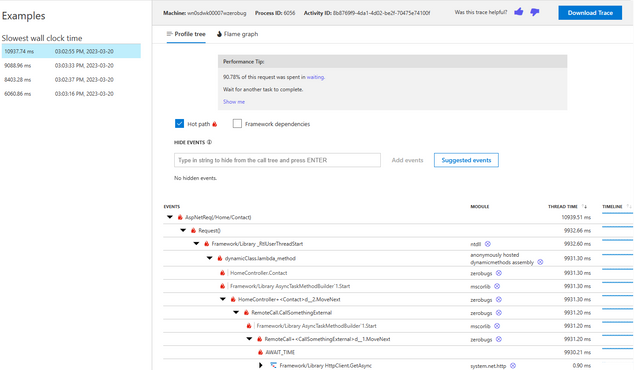
This requires other troubleshooting approach to take place. Going back to [Image 6], notice there is a blue button notifying that 4 profiler traces are available. This is the number of requests captured in profiler traces that are available for the current filters. Selecting this button will show the individual requests just as previous example.
[Image 9]
But now is not directly showing dependency calls but allowing to drill down into call stacks that were active in the context of the http request, providing information regarding where and how time was spent. Example in image above shows time was spent awaiting for a task to be completed (AWAIT_TIME) and it happens under application method CallSomethingExternal. So, for this example the root cause is found!
If displayed call stack is not detailed enough, enabling Framework dependencies option will show a more detailed call stack including framework frames that are skipped by default.
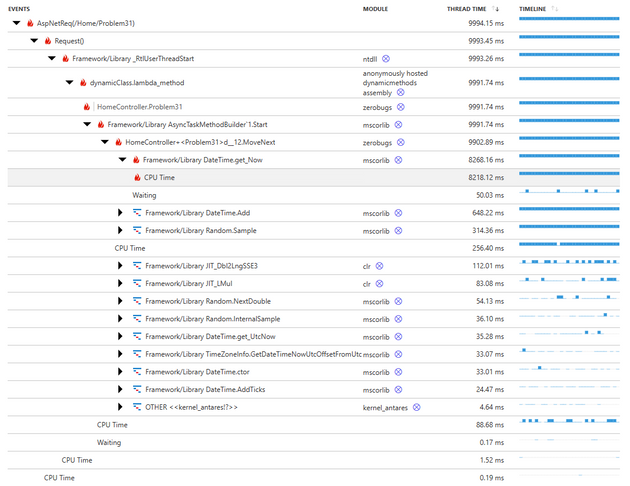
Bellow image shows a different example where delay is caused by complex or CPU demanding algorithm:
[Image 10]
To learn more about reading stack traces like these please check: https://learn.microsoft.com/en-us/azure/azure-monitor/profiler/profiler-data
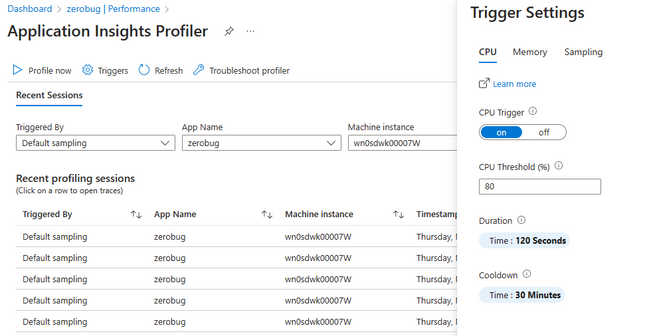
Filtering is usefull to scope down to the most relevant information but still, all profiling sessions can be found using the Profiler button at the top of the Performance troubleshooter:
[Image 11]
And can configure the profiler to trigger on CPU and memory metrics or just use the Profile now option for on-demand profiling:
[Image 12]
Check these and other available options at: https://learn.microsoft.com/en-us/azure/azure-monitor/profiler/profiler-settings
Other tools
Previous views are transaction or http request oriented, for situations where CPU usage does not appear to be related with incoming traffic or high CPU is constant, other tools can be used to find the source. Notice that in the list of profiling sessions there is an option to download, that option is also available when checking details for a request, check top right corner in image 9. When filtering a time frame where CPU usage was high and there are traces available, can download those trace files (.diagsession) and load them into tools like Visual Studio, Windows Performance Analyzer or PerfView.
Checking profiler trace using Visual Studio
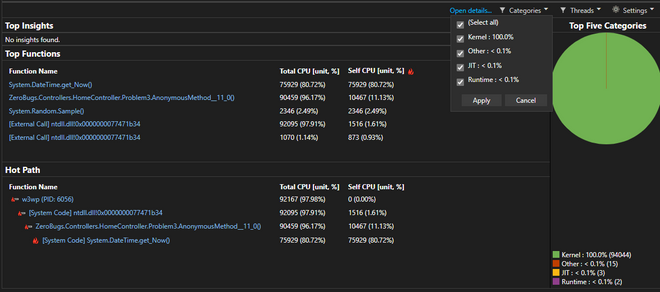
Opening the .diagsession file with Visual Studio will quickly point the code location causing the high CPU usage:
[Image 13]
Example above shows major source of CPU usage happening inside method named Problem3 and there is another frame for an anonymous method that should be the compilation result of a Task or delegate. Opening details can explore the full stack traces and other views but, for this case, high CPU source is already found.
Learn more about Visual Studio Performance Profiler: https://learn.microsoft.com/en-us/visualstudio/profiling/cpu-usage?view=vs-2022
Checking profiler trace using Windows Performance Analyzer
Another interesting tool to understand high CPU sources is Windows Performer Analyzer (aka WPA). Can get it from Windows Store: https://apps.microsoft.com/store/detail/windows-performance-analyzer/9N0W1B2BXGNZ or installing Windows ADK: https://learn.microsoft.com/en-us/windows-hardware/test/wpt/windows-performance-analyzer
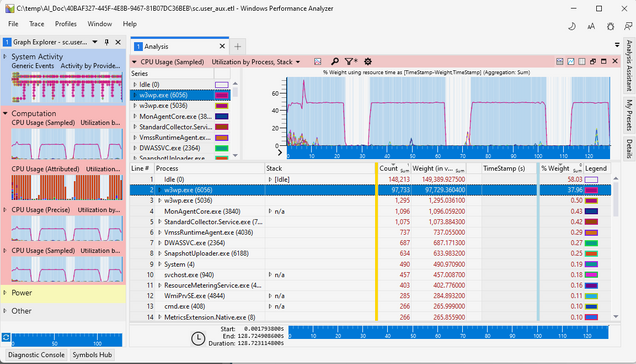
The .diagsession file is actually a zip, extract and locate the .etl file under a folder named with a guid. Open or drop the .etl file into WPA. Then, in the left expand "Computation" and double-click over CPU Usage, will open details for CPU usage over the trace, similar to image bellow:
[Image 14]
Note that the w3wp.exe process is selected, that causes the chart to add blue shadow to the timeline when process has higher activity. Some hints to focus on relevant data:
- Right click over the w3wp.exe process and "Filter to selection" to hide all other processes;
- Use the "Load symbols" option under Trace menu;
- Drag the mouse over the timeline chart to select the interesting time frame, right click on selection and zoom;
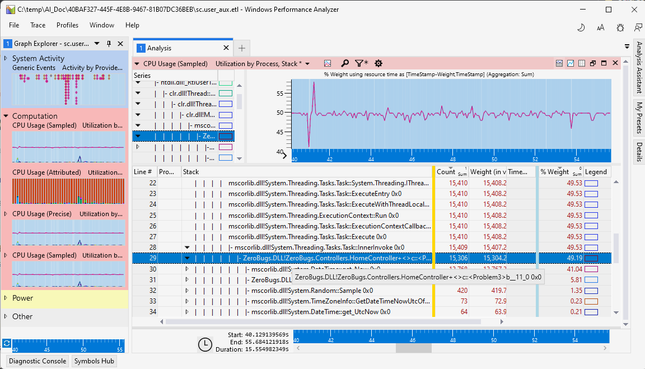
Then, in the process list, start expanding the stack trace always following the most impactful frames (see columns Count and %Weight). Drilling down the stack will again point to which methods in code are causing the higher CPU usage, that is where the development team should focus to improve the code:
[Image 15]
In situations where higher CPU usage is from garbage collection activities, skip those and check next frames with lower weight, will be able to find which are the methods causing the GC activity.
To learn more about WPA: https://learn.microsoft.com/en-us/windows-hardware/test/wpt/windows-performance-analyzer
Remarks
Having the Application Insights profiler enabled will cause traces to be collected once per hour for 2 minutes. Impact in availability is usually neglectable although in some scenarios can cause short term CPU spikes. This is observed more frequently in applications running in small workers that have a high rate of exceptions and snapshot debugger enabled as well.
Also, having worker instances with CPU usage steady at 100% can cause manual trigger operation to fail or timeout. Might need to retry or change to larger worker before.
Conclusion
Having the profiler option enabled in Application Insights is a great way to root cause past events without having to wait for problem to happen again to collect fresh data. Traces can be isolated, verified and changes applied avoiding future incidents.
In this article is shown how to isolate relevant data in timeline, locate traces and use them to root cause analysis.
Recommended content
Azure Monitor Insights overview
https://learn.microsoft.com/en-us/azure/azure-monitor/insights/insights-overview
Enable Profiler for Azure App Service apps
https://learn.microsoft.com/en-us/azure/azure-monitor/profiler/profiler
View Application Insights Profiler data
https://learn.microsoft.com/en-us/azure/azure-monitor/profiler/profiler-data
Analyze CPU usage without debugging in the Performance Profiler (C#, Visual Basic, C++, F#)
https://learn.microsoft.com/en-us/visualstudio/profiling/cpu-usage?view=vs-2022
Windows Performance Analyzer
https://apps.microsoft.com/store/detail/windows-performance-analyzer/9N0W1B2BXGNZ
PerfView
You must be a registered user to add a comment. If you've already registered, sign in. Otherwise, register and sign in.
