- Home
- Azure
- Apps on Azure Blog
- Automated and customized dashboards for Azure Load Testing
- Subscribe to RSS Feed
- Mark as New
- Mark as Read
- Bookmark
- Subscribe
- Printer Friendly Page
- Report Inappropriate Content
Many of you have been leveraging Azure Load Testing (ALT) to evaluate how your applications respond to high scale load and get actionable insights to fix performance bottlenecks. If you haven’t started yet, you can get started and run your first load test in less than 10 minutes.
Azure Load Testing (ALT) provides a unified dashboard of test statistics, client-side metrics, and server-side metrics so that the performance bottlenecks can be easily identified. While the out of the box dashboard is helpful in most scenarios, you might want the load test results to be available in a tool of your choice –
- You have a dashboard to monitor multiple aspects of service reliability and you want to see load test results in that dashboard.
- You want to observe the trend of specific metrics across test runs over a period.
- You want to customize the set of metrics and charts in the dashboard to better suit your needs.
- Share the test results broadly, with those who do not have access to your Azure subscription.
Your custom needs can be easily met through a one-time set up using the automation options available for Azure Load Testing in the form of REST APIs and SDKs.
Let’s walk through a scenario.
Test scenario
For this demo, let’s use a sample .NET Podcast web application where users can explore different categories, search for podcasts, and listen to them.
We are interested in tracking the performance of three specific pages in this application – Homepage, Discover page and Subscriptions page – when 500 concurrent users use this application for five minutes. We run periodic performance tests to track the performance for this scenario We wish to view these results on a dashboard to track the trends in metrics and easily identify any major differences.
Set up and run a load test
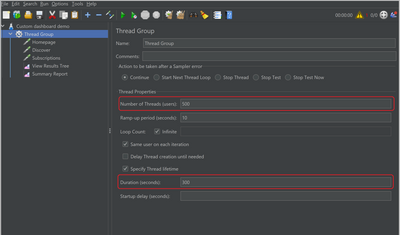
Here is a simple JMeter test set up for our scenario. We have an HTTP sampler for each page and a thread group to simulate 500 concurrent users for 5 minutes.
Let's now go ahead and create a test in Azure Load Testing. For this simple scenario, we just have to provide the basic test details such as name, description and upload the JMeter script. Once the test is created, we can run it whenever there is a need to assess the performance of the web application. For each run, we can provide a description to indicate why the test was run.
Export test results to dashboard
Now that we have a test set up and we are able to run it whenever needed, let’s see how we can automatically populate a dashboard with the test run results.
Let’s say we have a PowerBI report where we monitor multiple aspects of the web application, and we need the load test results to be one of the pages in the report. This can be achieved in three simple steps.
- Get the test run results in the form of a CSV file by using ALT Python SDK.
- Upload the CSV file to a blob storage container by using the Azure Storage SDK.
- Connect the PowerBI dashboard, with required visualizations, to read data from the blob storage container.
A sample Python script with the above steps is available here. We can run this script after every test run by providing the test run ID and the dashboard gets updated.
In this example, we have used ALT Python SDK, Azure Blob storage and PowerBI but the same can be achieved using different combinations of programming languages, databases, dashboarding tools, ALT APIs and SDKs. For example, you can use ALT REST APIs to fetch the results, store the results in an SQL database and connect it to a Grafana dashboard; you can also use a combination of .NET SDK for ALT, PostgreSQL and Tableau, depending on your tech stack.
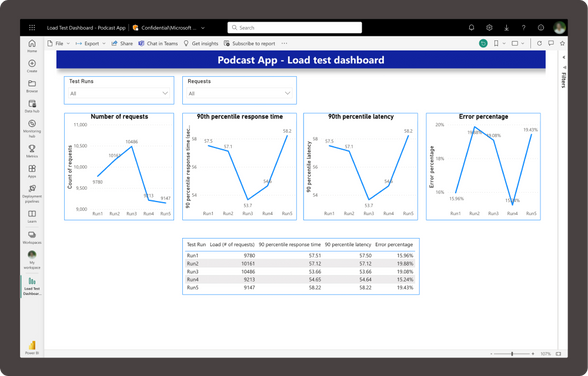
Here is a sample PowerBI report from five test runs of the load test against our podcast application. The PowerBI template used is available here.
This dashboard can be used to make inferences on the performance trends of the web application and take any corrective action. Here, we can see that the latest run has high response time, latency and error percentage as compared to the earlier runs. We can go and investigate what happened between test run 4 and test run 5.
Want to replicate the same for your test runs in Azure Load Testing? You can do it in 3 simple steps –
- Download the Python script and update the load testing inputs – Subscription ID, Resource name etc.
- Create a container in a storage account and update the storage account inputs in the Python script.
- Download the PowerBI template and update the connection settings to point to your storage account.
The resources used for this sample scenario are available in the Azure Load Testing samples repository.
We have created a test in Azure Load Testing to simulate load against a podcast web application and created a python script that can be run after every test run to update a custom PowerBI dashboard. You now know how to integrate Azure Load Testing results with the dashboarding tool of your choice.
If your scenario is to run load tests at a regular cadence and view the results in a dashboard, the end-to-end flow can be automated without any manual intervention. We will talk about it in another blog post. Until then, Happy Load Testing…...!
If you have any feedback on Azure Load Testing, let us know through our feedback forum. Refer to the previous blogposts on Azure load testing here.
You must be a registered user to add a comment. If you've already registered, sign in. Otherwise, register and sign in.


