- Home
- Azure
- Azure Integration Services Blog
- Scaling Logic Apps Standard – Sustained Event Processing System
- Subscribe to RSS Feed
- Mark as New
- Mark as Read
- Bookmark
- Subscribe
- Printer Friendly Page
- Report Inappropriate Content
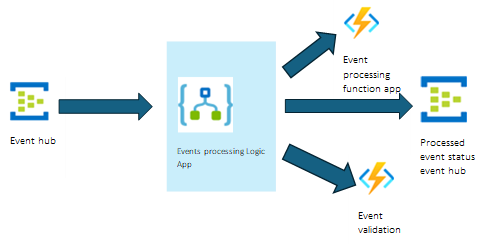
In the previous blog of this blog post series, we discussed how Logic App standard can be used to process high throughput batched data. In this blog, we showcase an application crafted with Azure integration services components, aiming to streamline the event processing. The events are sent to an event hub at a sustained rate, the logic app workflow processes each event by initiating a series of actions. These actions encompass the processing of the relevant event information using variables, conditions, scopes, and Azure functions for processing them, followed by sending the status of the processed event to another event hub. We will discuss two scenarios, one for the high throughput and the other one to handle throttling limitations, to protect the downstream services.
High throughput event processing Logic App
An influx of 4 million events is ingested through this process in a span of 8 hours. The workflow uses the event hubs built-in trigger, so the events are promptly picked up and are processed in the run at par with ingress rate. Each workflow run orchestrates several data transformation steps and collaborates with other services to enrich each event payload with additional data and then finally sends it to another event hub.
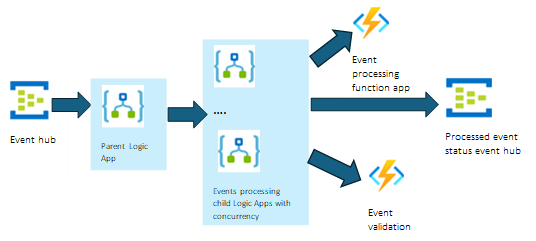
Event processing Logic App with throttling limits on downstream services
Now let’s handle the scenario where downstream services have throttling limits. We will use a parent workflow which reads events from
the event hub and randomly sends the events to a child workflow which has 100 concurrency set on it for processing.
During this test 10K events per minute were pushed to the event hub for 3-4 hours and it took close to 5 hours to complete processing cause of the slowdown from concurrency.
|
Tests setup |
High throughput event processing Logic App |
Event processing Logic App with throttling on downstream services |
|
Number of workflows |
1 |
11 (1 parent, 10 child workflows) |
|
Triggers |
Event hub |
Event hub |
|
Actions |
Event hub, variables(3), Functions (3), compose(2), conditions(6), scopes(8) |
Event hub, variables(3), Functions (3), compose(2), conditions(6), scopes(8) |
|
Number of storage accounts |
4 |
4 |
|
Prewarmed instances |
20 |
20 |
|
WS Plan |
WS3 |
WS3 |
|
Max Scale settings |
100 |
100 |
|
Host settings used: Event hubs extension event batch size = 100
|
"eventHubs": { "maxEventBatchSize": 100 } |
"eventHubs": { "maxEventBatchSize": 100 } |
|
Exponential retry on nested workflow call |
N/A |
"retryPolicy": { "count": 4, "interval": "PT20S", "maximumInterval": "PT1H", "minimumInterval": "PT10S", "type": "exponential" } |
|
Concurrency |
N/A |
100(on HTTP trigger in child workflow) |
Performance characteristics
High throughput event processing Logic App
Events processing trigger Rate
Receiving over 10K/min events at a sustained rate for 8 hours.
Action Execution Rate
Consistent action execution rate of 250K actions/min for the 8 hours load run.
Job Execution Rate
Execution rate at the sustained average rate of 400k/min for whole of the run and maximum going to 600K/min.
Execution delay and instance scaling
- The app had a prewarmed instance count of 20 and took about 40mins to scale out to 40 instances and during the whole run it used an average of 45 instances after the ramp-up.
- The 95th percentile execution delay stayed below 170ms for the most part but increased to maximum 4s during the compute ramp-up. This is expected since more jobs got queued up during the ramp-up period than were dequeued for processing.
Execution Delay
Instance count
Event processing Logic App with throttling limits on downstream services
Action Execution Rate
The action execution rate of 200-250K actions/min for the 4 hours load run and then draining the queue runs for close to an hour after the test was stopped.
The action execution rate per workflow is 15K-20K actions/min.
Runs Execution Rate
The run execution rate of 12K-15K actions/min for the 4 hours load run and then draining the queue runs for close to an hour after the test was stopped.
The runs execution per workflow is 700-800 runs per minute.
Job Execution Rate
Execution rate of close 400k/min for whole of the run.
Execution delay and instance scaling
- The app had a prewarmed instance count of 20 and took a maximum of 32 instances after the ramp-up.
- The 95th percentile execution delay stayed below 300ms for the most part but increased to a maximum 600ms during the compute ramp-up. This is expected since more jobs got queued up during the ramp-up period than were dequeued for processing.
Execution Delay
Instance count
Results Summary
- This case study shows patterns for processing sustained high throughput load and controlling the throttling limits for the downstream services.
- 10K events per minute are processed by a single workflow and the processing is at par with the ingress rate.
- When concurrency knobs are used to slow down to protect the downstream services, there is a delay in processing of events. 4 hours run takes close to 5 hours to complete.
|
|
High throughput events processing Logic App |
Logic App with throttling limits on the downstream services |
|
Total number of events processed |
4,800,000 |
1,538,200 |
|
Total processing time |
8 hours |
4 hours |
|
Triggers |
10k/min sustained events read |
10k/min sustained events read |
|
Actions |
250K actions/min sustained rate. Total actions executed: 115.2M |
150K actions/minute sustained rate Total actions executed: 57M |
|
Jobs |
600K/min job rate at peak 400K/min job rate sustain |
490K/min job rate at peak 400K/min job rate sustain |
|
Execution delay |
95th percentile increased up to 4s during scale-out and came back below 170ms at sustained load |
95th percentile increased up to 600ms during scale-out and came back below 300ms for most part of the run |
|
Scale out |
Scaling instance count from 20 to 40 took about 40mins with maximum 52 instances. |
32 maximum instances used over the course of the run |
References:
Refer blog for using multiple storage accounts in the app.
You must be a registered user to add a comment. If you've already registered, sign in. Otherwise, register and sign in.


