- Home
- Azure
- Apps on Azure Blog
- Load patterns for holiday shopping season testing
- Subscribe to RSS Feed
- Mark as New
- Mark as Read
- Bookmark
- Subscribe
- Printer Friendly Page
- Report Inappropriate Content
You want to make sure your application is prepared for all your new and returning customers during the holiday shopping season, right? Well, we have some tips.
We walked through how to set up, run and analyze user loads with Azure Load Testing in part one of this series. In part two we will test different load patterns to show you how simulate them in Apache JMeter. A load pattern specifies how the simulated user load is adjusted during a load test.
While you might run smoke tests regularly with minimal load to avoid regressions, big events present scenarios to consider different types of load testing.
In this article we’ll discuss step loads, spike tests, breakpoint testing and soak testing patterns. Let’s get to it!
Estimate the load
You could estimate the expected load for your application during the holiday season by looking at previous traffic analytics. But, for instance, Adobe estimates that year-over-year (YoY) online sales are predicted to go up 2.8% in 2022. For this specific example, we assume that the estimated concurrent virtual users during your sales event is 4,000.
Tip: Use the “think time” delays in your scripts to more accurately mimic the expected behavior of a real life user.
Load Patterns
The Ultimate Thread Group JMeter plugin enables you to implement advanced load patterns for your test. We recommend that you initially set the number of threads (aka virtual users) to 250 in the JMeter script. You can then run the script across multiple test engine instances in Azure Load Testing to achieve your target number of virtual users. The formula is: Total virtual users = (virtual users in the JMX file) * (number of test engine instances).
For example, to simulate 4,000 virtual users, you can set 250 threads in the JMeter script and run it on 16 engines. Go here to learn more about threads and virtual users.
Depending on the engine health, you could further increase the number of threads beyond 250. Learn how you can monitor the health of your test engine instances.
Step load tests
You’ll likely see increased traffic before the sales begin as customers browse your store and prepare their carts and wish lists. Then you’ll see an increased load once the sale starts and customers begin placing orders. It’s good to test your system under different levels of load using step load.
To do this, configure the load to run at 50%, 100% and 200% of the estimated holiday shopping season load. See the image below.
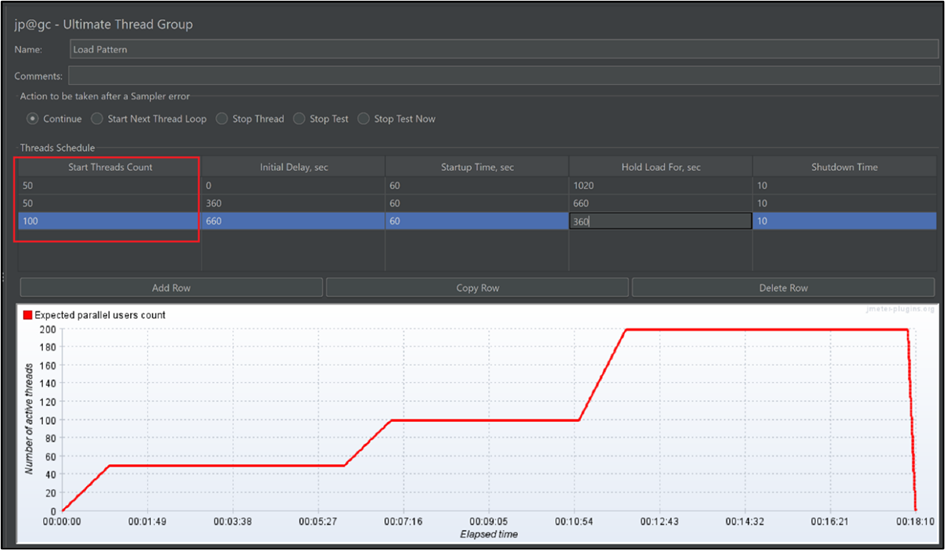
Here’s how you configure this in JMeter script.
1. Start the load at 50% concurrent users, then set the following configuration:
- Start Threads Count: 50
- Startup Time: 60 seconds
- Hold Load For: Hold each for at least 10 minutes, which makes the total duration of the test to ~30 minutes.
These 50 threads will eventually run on 40 engines in Azure Load Testing, giving you a total of virtual users.
2. Eventually increase the load to 100% concurrent users, then set the following configuration
- Start Threads Count: 50.
- Startup Time: 60 seconds
- Initial Delay: The duration after which you’d like to increase the load.
- Hold Load For: The remainder of the test.
These 50 threads will eventually run on 40 engines in Azure Load Testing, giving you a total of 2000 virtual users.
Similarly, after some time, increase the load to 200% of your estimated traffic.
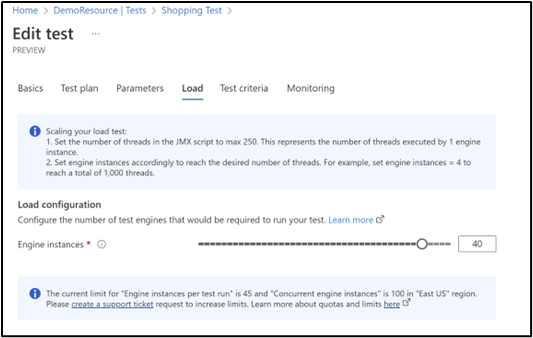
Now that you have your script ready, you can use Azure Load Testing to run the script at scale without worrying about provisioning or maintaining the infrastructure. Create an Azure Load Testing resource and create a test using the JMeter script that we created above. In the Load tab, select 40 engines to run the test.
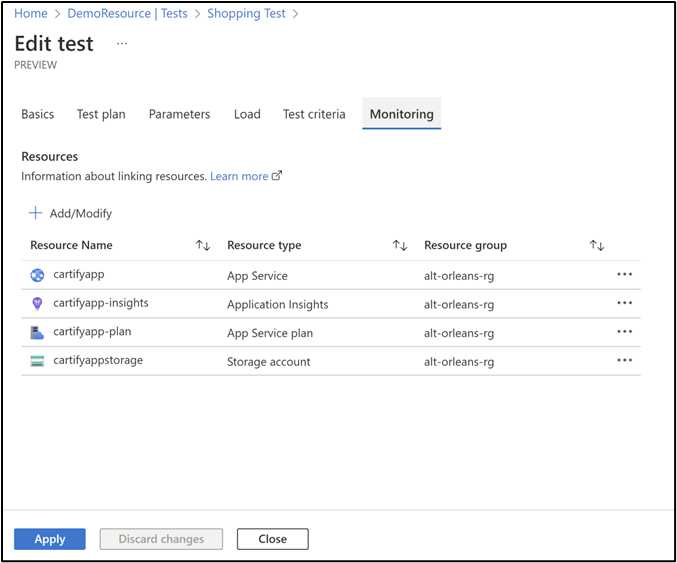
You can also monitor the app components to see how they perform under load.
Now run the test.
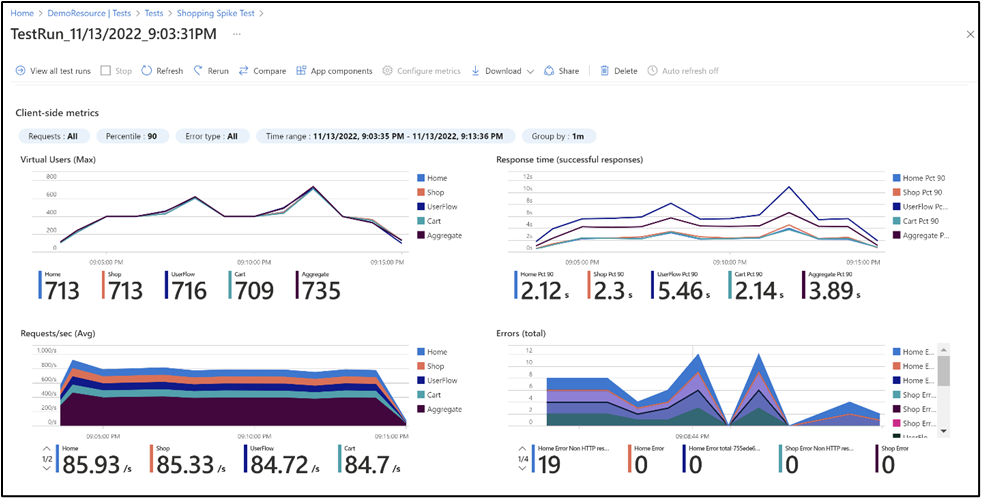
You will be able to see the load shape similar to what you configured in the JMeter script, while the actual load is multiplied by the number of engines selected. The screenshot below shows how the shape of the load would look when you run the test.
Here you should monitor if the response time or errors increased significantly at higher load levels. You can correlate this with your server-side metrics to see which component could be causing the performance degradation.
Spike test
Another type of performance testing is spike tests where you configure a sudden spike in user load. This test is useful to prepare for site launches or Black Friday peaks. After the strain, scale back the load to see how the system recovers after the spike. You can start the load at 100% of the estimated load and introduce spikes at different levels in between. The load pattern would look like what’s shown.
Here’s the steps to configure this in your JMeter script.
1. Start the load at 100% of the estimated concurrent users, then set the following configuration
- Start Threads Count: 100.
- Startup Time: 60 seconds
- Hold Load For: Total duration of the test
These 100 threads will eventually run on 40 engines in Azure Load Testing, giving a total of virtual users.
2. After some duration, introduce a spike which is twice the load, then set the following configuration
- Start Threads Count: 100.
- Startup Time: 20 seconds
- Initial Delay: The duration after which you’d like to introduce the spike.
- Shut down time: 20 seconds.
You can keep adding spikes at different intervals to monitor if your system is able to handle and recover from the spikes.
In Azure Load Testing, edit your test to upload the updated JMeter script, and then run the test. You’ll be able to see the load shape similar to what you configured in the JMeter script. Note that the actual number of virtual users is multiplied by the number of test engines selected.
You should monitor how your system reacted during and after the spike.
- If the system performance has not degraded during the surge in traffic, and the response time is similar during low traffic and high traffic –without major errors – it’s a good indicator.
- If the system produces errors during the surge in traffic, or the system crashes and does not recover after the traffic has subsided, you may need to take measures to improve the system’s recovery capabilities.
Soak tests
Holiday shopping season features many days of continuous activity. Certain issues might appear only when running for an extended period of time, such as memory leaks or queues that unload slowly. Make sure that your application is prepared for high performance throughout.
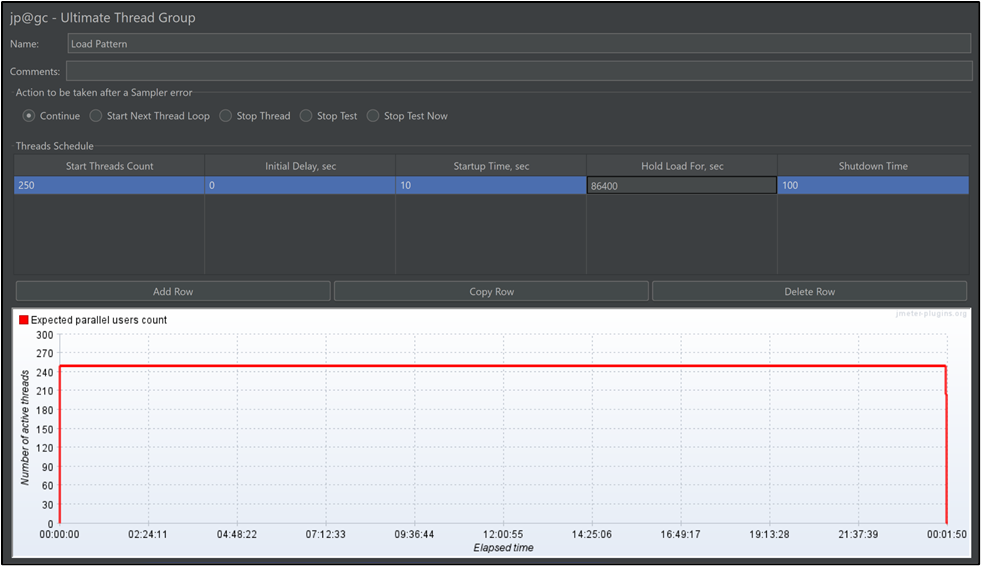
For a soak test, configure the estimated load at a constant level, but for a longer duration. The load pattern would look like what’s shown as shown below.
You can configure this as shown below in your JMeter script.
Start the load at 100% concurrent users, then set the following configuration
- Start Threads Count: 250.
- Startup Time: 60 seconds
- Hold Load For: Total duration of the test (less than three hours)
Azure Load Testing supports a maximum of three hours for a single test. You can integrate your load test in a CI/CD pipeline and schedule it every few hours to run a soak test.
If you notice any memory leaks, you should identify why it’s happening. A common cause is that you can run out of disk space as your file system fills up as request logs are written or temporary files are generated.
Breakpoint tests
Let’s take it one step further and push your app to its limits to determine its breakpoint. This helps you identify the maximum number of requests per second that your application can handle before the performance degrades. The load pattern would look like what’s shown below.
You can configure this as shown below in your JMeter script.
1. Start the load at 100% concurrent users, then set the following configuration
- Start Threads Count: 250.
- Startup Time: Total duration of the test
While running the test in Azure Load Testing, select the number of engines for your target load.
For more information, refer to our previous blogpost on how to discover your application’s breakpoint.
So, there we have it. These are the different load patterns that can help you get ready for the holiday season. Refer to the previous blogpost for details on how to analyze results and gain insights.
Now let’s get started with Azure Load Testing. Try it out and let the community know about your preparation for the holiday shopping season.
If you have any feedback on Azure Load Testing, let us know through our feedback forum.
Happy load testing!
You must be a registered user to add a comment. If you've already registered, sign in. Otherwise, register and sign in.
